
NeuraQuarium
Major Update: 1.0.6!
This is a big one, folks!
This update is all about promoting diversity in our Critter populations. The last several updates have been focused on improving the ability for traits to evolve and develop -- things like introducing paired reproduction so that neural nets can blend and change, and then the Population Merge tool to allow whole populations to get mixed up, interbreed, and compete. But unrestricted mingling of traits can lead to a regression to the mean -- every critter, everywhere, tends to become more average. With the changes in this update, you will see more extreme behaviors and traits evolve, even to the point of allowing species who occupy separate niches to co-exist (at least, for a while!)
Longevity
The smallest change is to simply limit the lifespan of every creature. In some cases, a critter that had a relatively successful combination of behaviors could simply survive, forever, sometimes never even reproducing, just taking up space and energy. Now, every critter has a ticking clock (based on their mature size) that eventually runs down to zero.
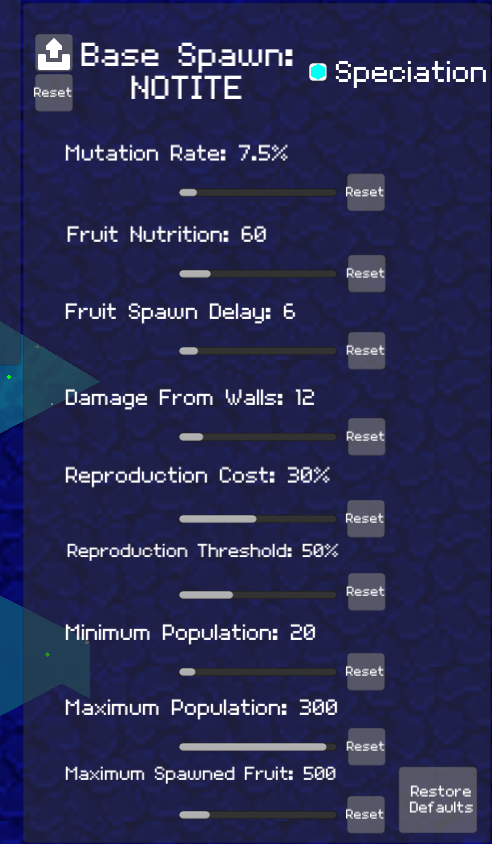
Speciation
This is the real meat of the update in terms of making your simulations more dynamic, diverse, and interesting. All critters now keep a record of their lineage going back six generations. If the Speciation option is turned on (it is on by default for any new games, but will be toggled off in any old save game you load,) a few things happen.
Firstly, whenever a critter seeks a mate, they will be unable to reproduce with any other critter with whom they share no common ancestors. (Again, we only look back six generations -- so if the two critters' last common ancestor was 7 or 8 or 20 generations back, they are considered different species.)
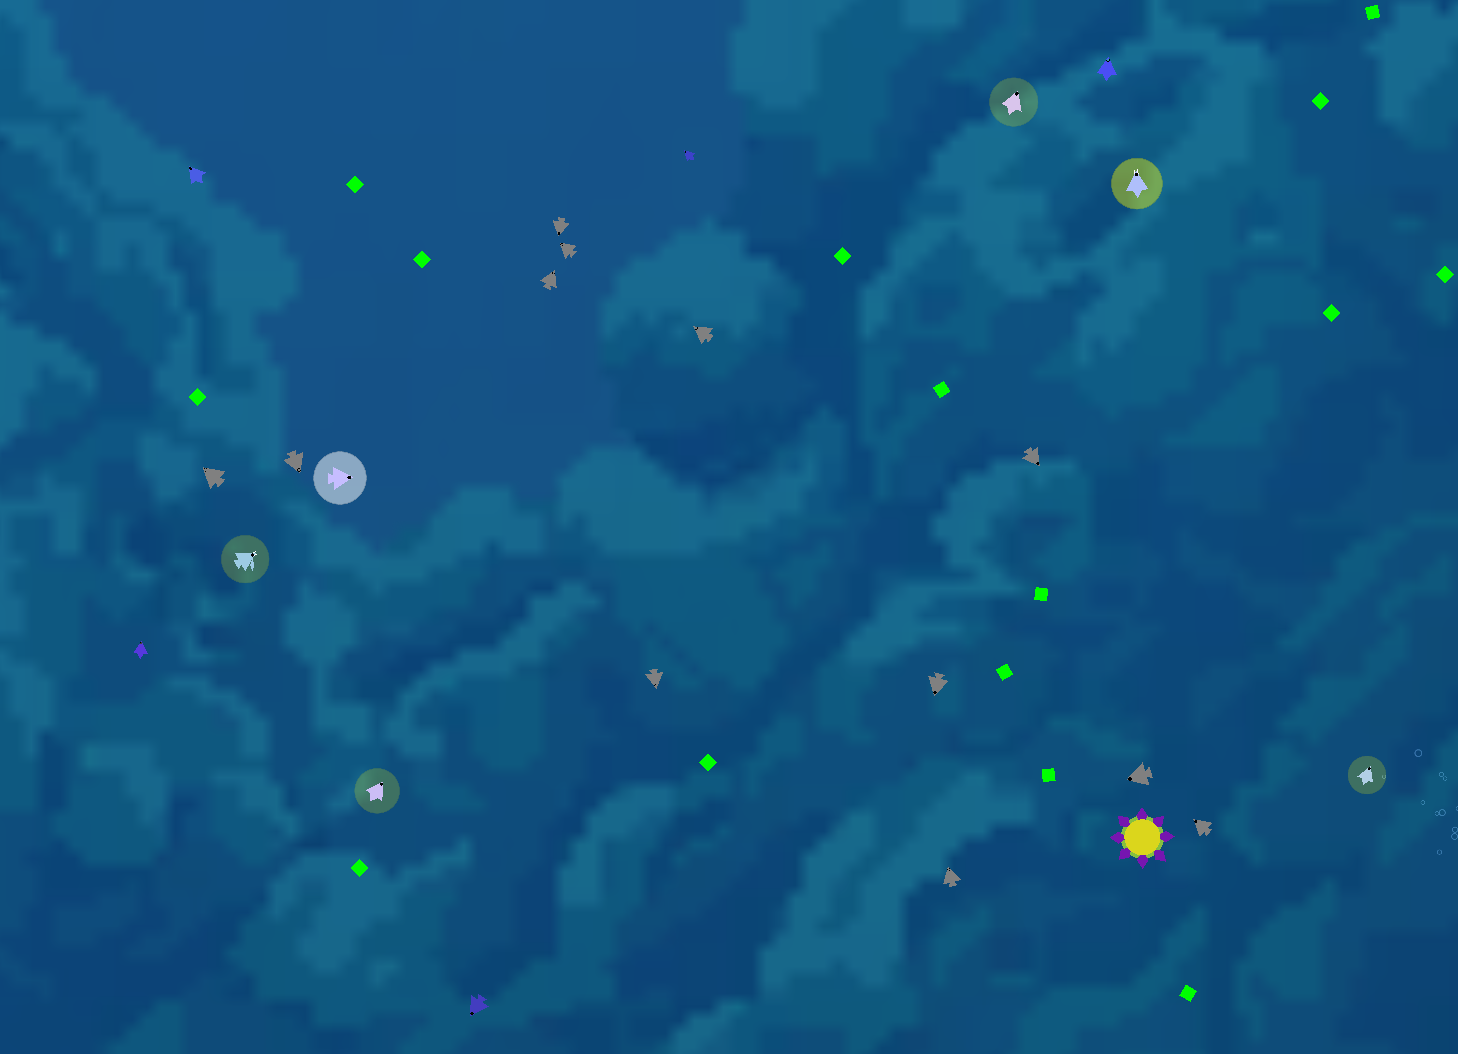
Second, you will see glowing yellow highlights appear around the critters that are potential mates. Those that are not yet mature will be highlighted, but not as brightly, and the critter you have selected will be highlighted in white.
Population Heatmaps
The last feature is an add-on to the existing population distribution charts.
While it was really neat to finally be able to see at a glance how many of your critters were omnivores, or the proportion of bigger to smaller body sizes, the first iteration of these charts didn't do anything to help you see who represented these categories. Are the fastest critters spread evenly across the map? Do the oldest generations linger in one corner while the youngest have expanded to a new area? Is a shift in dietary trends localized in a particular area? Well, now we can see!
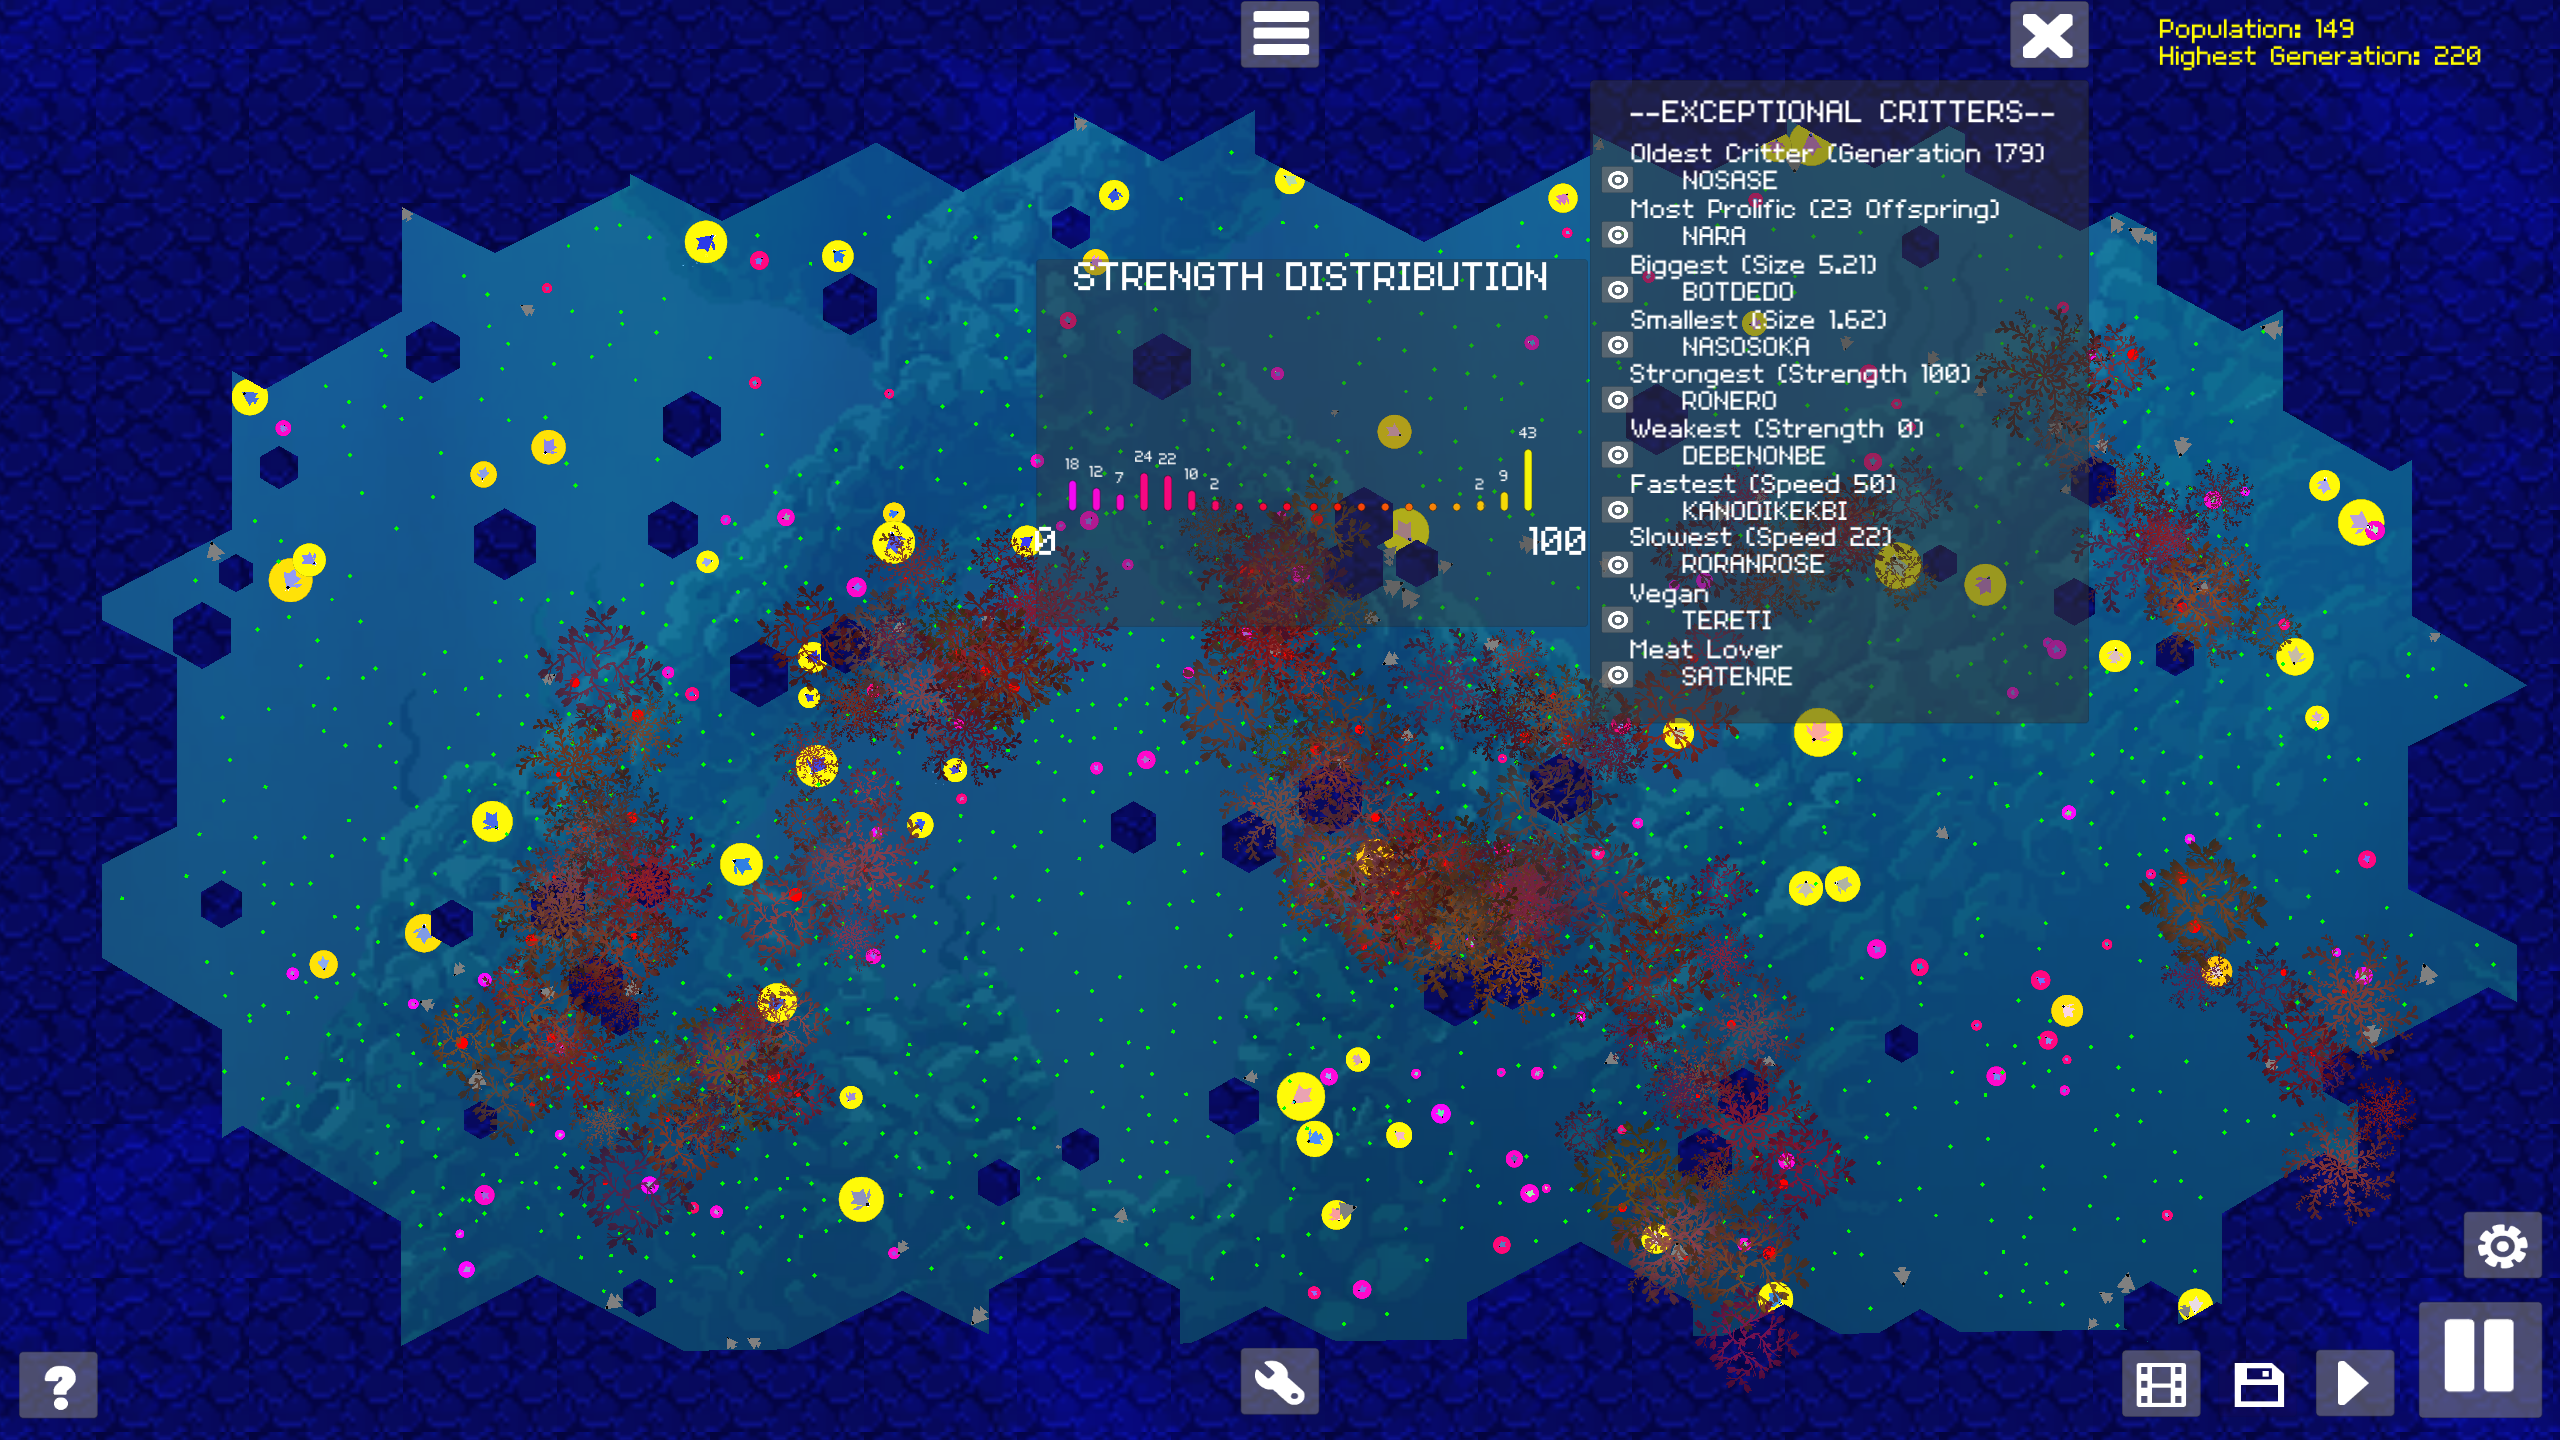
When you hover over the text of a line in the Stats/Exceptional Critters pane, now not only will the graph appear, but the bars will be color-coded ranging from purple to yellow, and every critter will be highlighted according to its place on the graph. See here how the strongest and weakest critters are spread across the map.
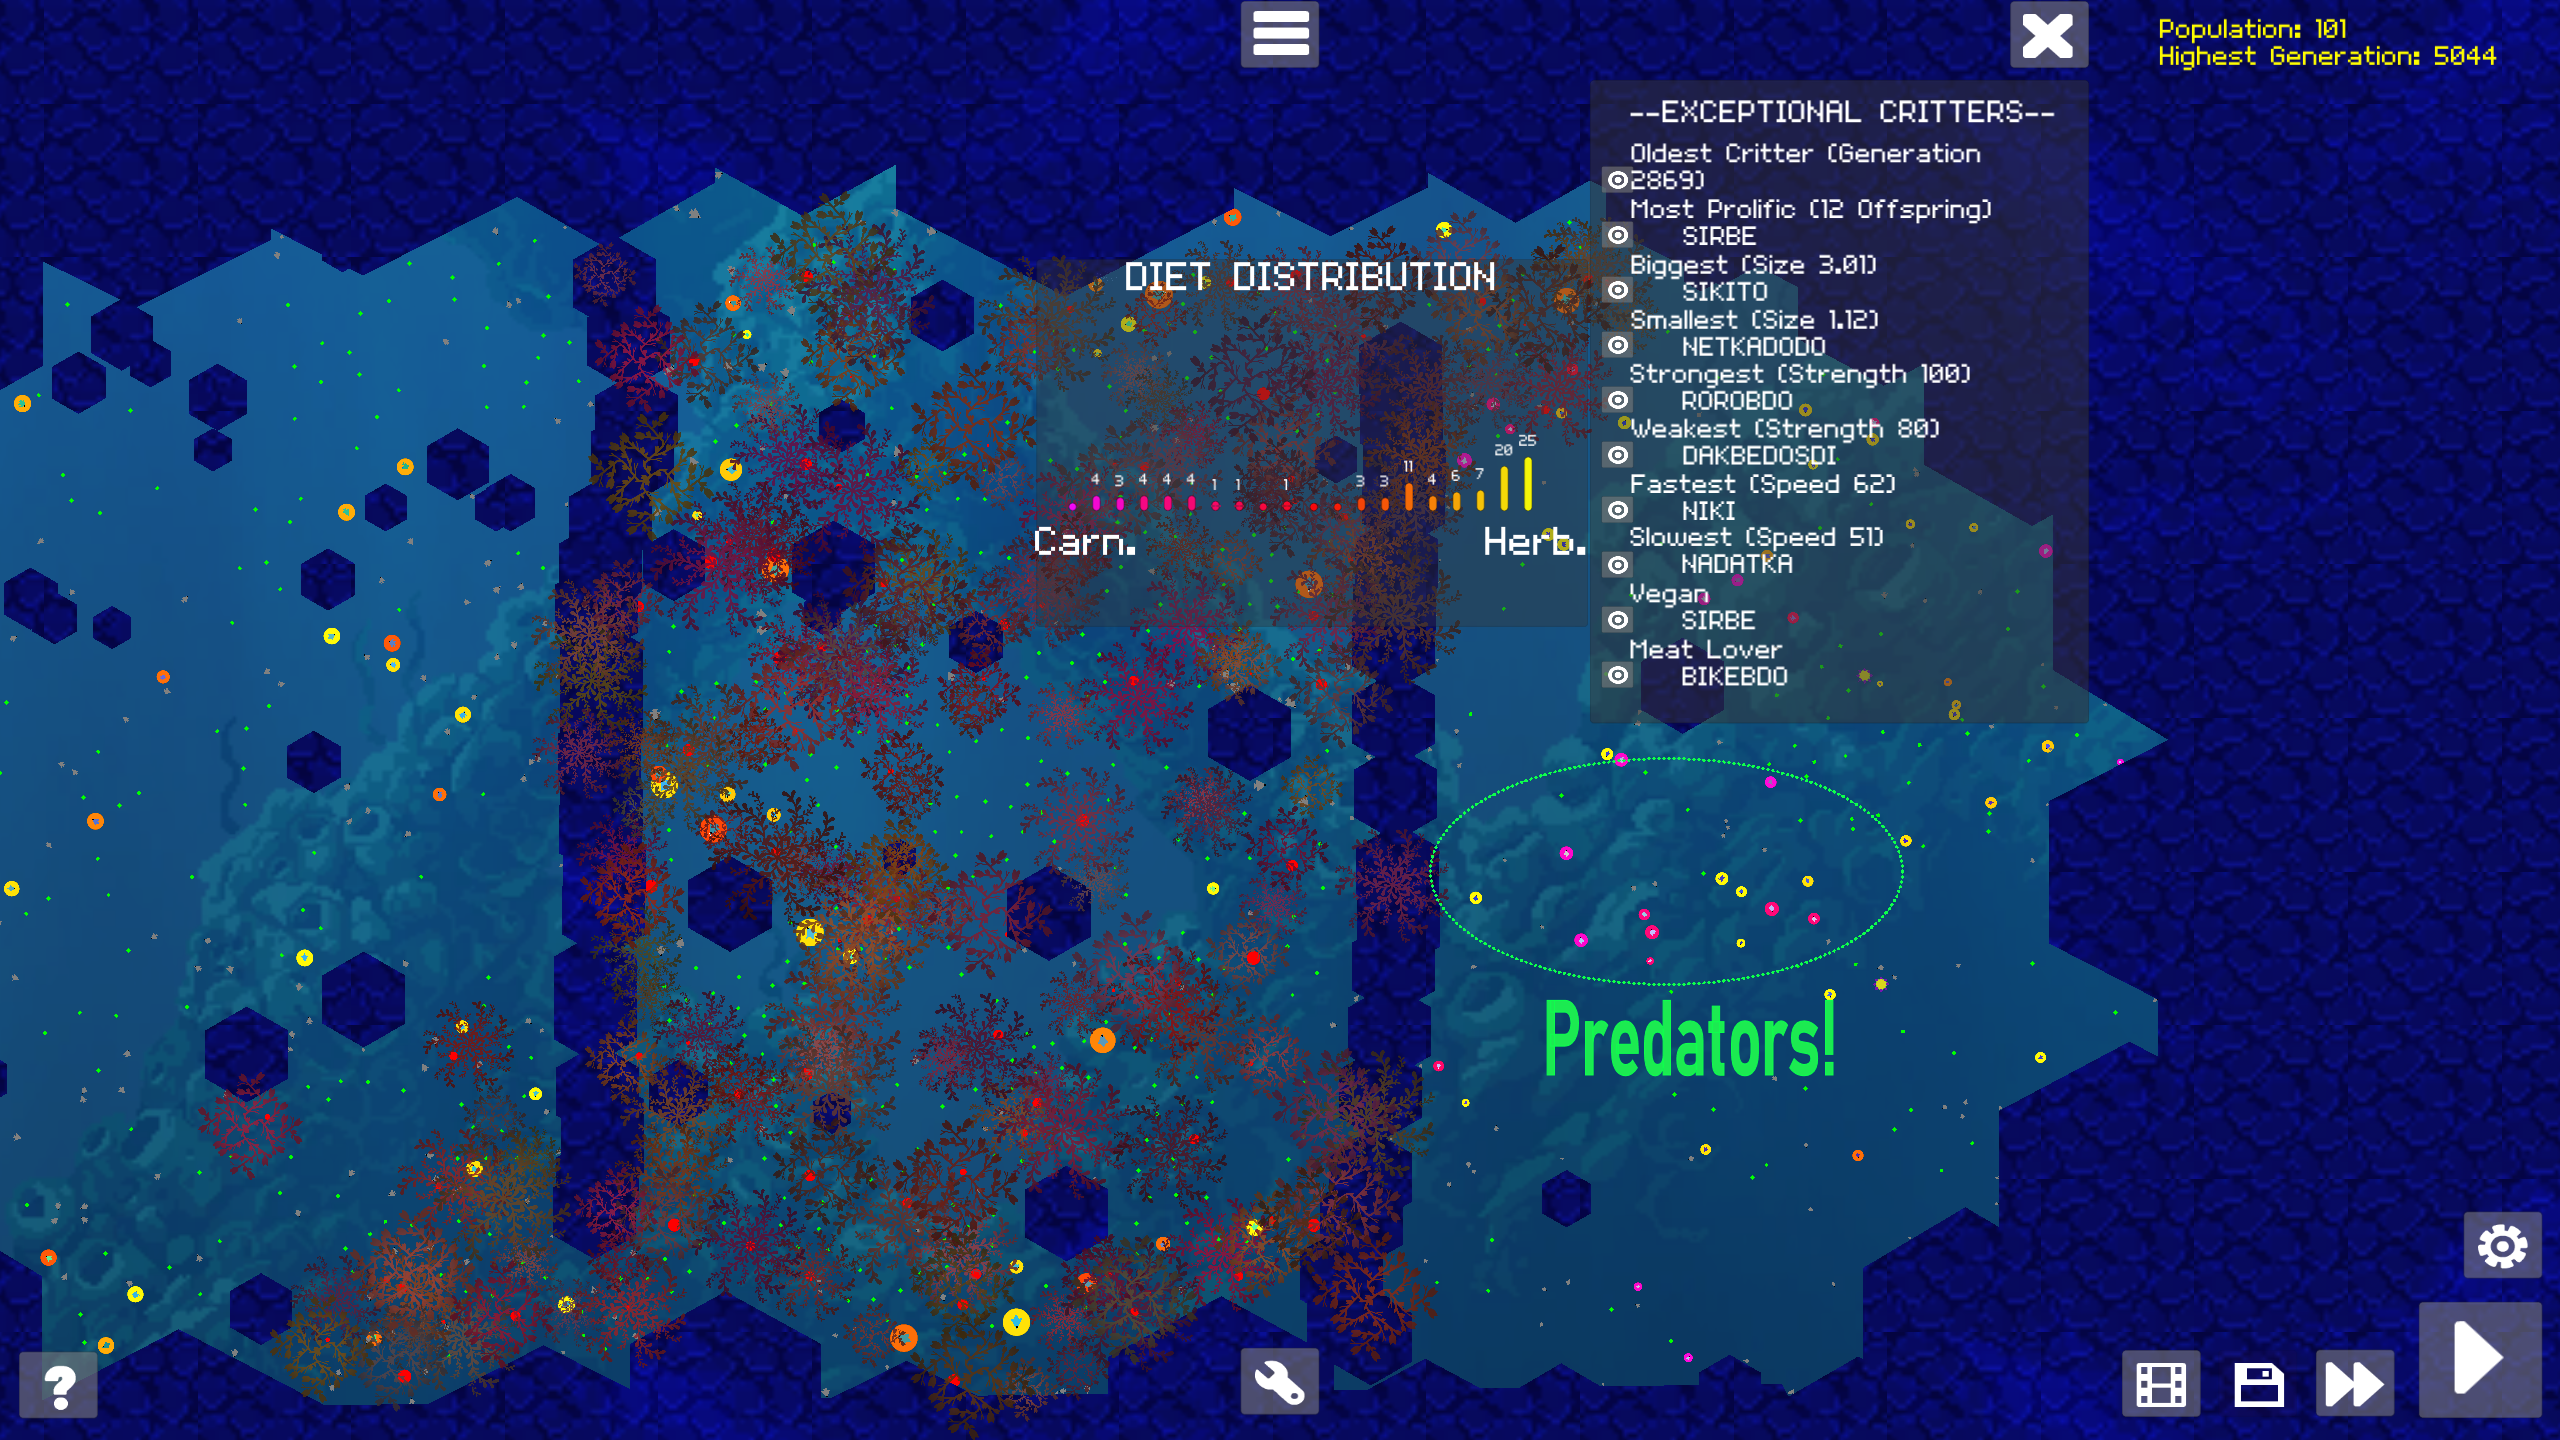
And see here -- we can identify one small pocket where true carnivores have evolved to scavenge the remains of the carefree herbivores who feed on the plentiful fruit provided by Dispensers in one end of this otherwise somewhat barren (500 max fruit) map. (In a few more generations, the carnivores aggressively hunted down the herbivores, driving both populations to extinction.)
This screenshot represents the real potential of this update, to me. Seeing predation emerge purely through evolution is something I have wanted to see since this project's inception, and it would have been much less likely to happen without the introduction of the speciation feature, and much harder to trace and track without this added heatmap feature.
I'm really excited to see what happens next!
Comments
Log in with itch.io to leave a comment.
Oooh!